The most expensive IVF lead is the one that looks cheap in a report and never becomes a patient
Effective IVF marketing performance is measured by combining cost per lead with quality metrics like the lead to patient rate and patients per 100 leads to identify which channels actually drive clinical growth. Relying on low lead costs alone often results in phantom volume that inflates reports without increasing patient intake, so clinic owners should use a bubble chart diagnostic to reallocate budget toward high intent sources that convert into consultations.
#1 | Irresist IVF Insights
The monthly agency report lands. CPL is down 18%. Someone on Slack types "🎉." But patient intake this quarter? Flat. If that scenario feels familiar, you're already paying for leads that look good in a dashboard and disappear before consultation.
CPL (Cost per Lead) isn't useless - it tells you the cost of an inquiry. What it can't tell you is whether that inquiry ever becomes a patient. This article introduces three metrics - CPL, lead_to_patient_rate, and patients_per_100_leads - that together give a complete picture of IVF channel performance. This is article #1 in the Irresist IVF Insights series, built for IVF clinic owners and growth leaders making real budget decisions. Think of it as a working diagnostic, not a theory piece.
Key Takeaways
CPL measures cost, not value - A cheap lead that never books a consultation costs more than an expensive one that becomes a patient.
Three metrics together reveal the full picture - Pair CPL with
lead_to_patient_rateandpatients_per_100_leadsto compare channels on what matters: patient output.The bubble chart forces a portfolio view - Plotting CPL against quality with volume as bubble size exposes where budget is working and where it's leaking.
Phantom volume is real - High lead counts from broad-targeting channels can inflate reports while starving your intake calendar.
Start with 90 days of CRM data - You likely already have enough data to run this diagnostic next week.
Cost Efficiency vs. Quality of Growth
Cost efficiency asks: how cheaply can we get a lead? Quality of growth asks: how reliably does a lead become a patient? These two questions can pull your ivf marketing analytics in opposite directions.
Consider a paid social channel generating leads at $35 each versus an organic content channel at $110 per lead. The social channel wins on CPL by a wide margin. But if its lead_to_patient_rate is 3% and the organic channel converts at 11%, the cheaper leads are producing fewer patients per dollar spent.
Those high-volume, low-cost leads are what we call phantom volume - inquiry counts that inflate reports but represent people who aren't ready, aren't qualified, or never intended to book. In fertility, where decision cycles span 6 to 18 months, early-funnel ivf lead quality is a leading indicator of future revenue.
Here's how this plays out with illustrative numbers:
| Channel A (Paid Social) | Channel B (Organic/SEO) | |
|---|---|---|
| CPL | $35 | $110 |
| Leads (90 days) | 600 | 150 |
| lead_to_patient_rate | 3% | 11% |
| patients_per_100_leads | 3 | 11 |
| Estimated patients | 18 | 16.5 |
| Implied cost per patient | $1,167 | $1,000 |
All values are illustrative. Your clinic's numbers will differ based on market, budget, offer, and site experience.
Channel B produces nearly as many patients from one-quarter the leads - at a lower cost per patient. The fertility clinic CPL comparison alone would have pointed you toward Channel A.
What the Bubble Chart Is Actually Telling You
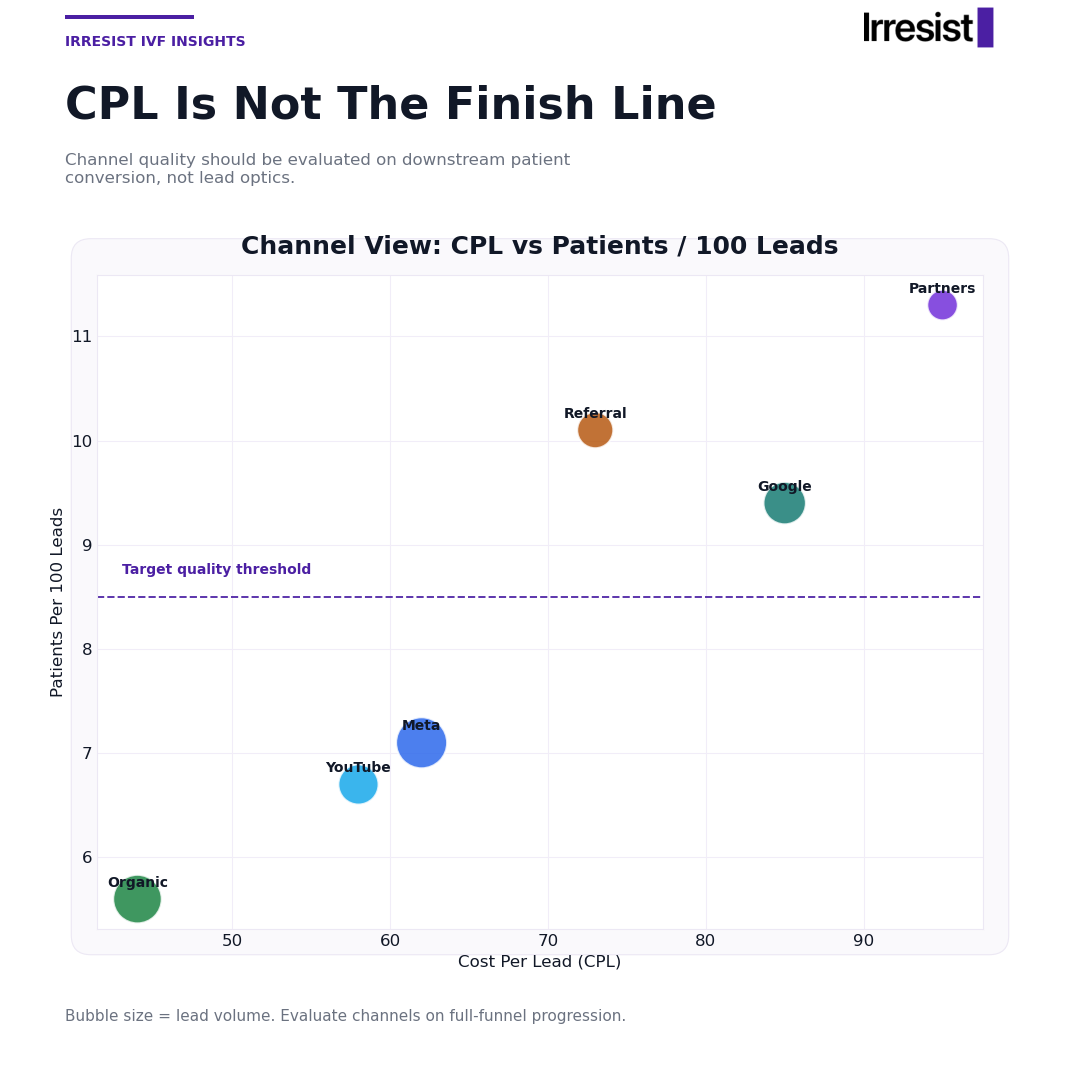
The bubble chart plots three dimensions at once: the x-axis shows CPL (lower is cheaper), the y-axis shows patients_per_100_leads (higher is better quality), and bubble size reflects raw lead volume from that channel.
Each quadrant tells a different story for your clinic:
Top-left (low CPL, high quality) - Your best channels. Prioritize and scale.
Bottom-left (low CPL, low quality) - Misleading value. Cheap leads that don't convert.
Top-right (high CPL, high quality) - Expensive but productive. Optimize cost or protect spend.
Bottom-right (high CPL, low quality) - Cut or pause immediately.
Bubble size adds a critical third dimension. A tiny bubble in the top-left may need volume investment before it can carry real weight. A massive bubble in the bottom-left might be consuming budget that belongs elsewhere. Any chart values described here are illustrative benchmarks - actual clinic performance varies.
This visualization forces a portfolio conversation rather than a single-channel optimization reflex.
A Diagnostic Workflow for Channel Budget Decisions
Run this four-step process monthly or quarterly using data from your CRM and ad accounts.
Step 1: Pull the Right Numbers
For each channel, gather three data points: total leads generated, CPL, and patients attributed (or booked consultations as a proxy). Most clinics track leads and spend in ad platforms but don't connect those leads to downstream CRM outcomes. This step surfaces that gap.
Step 2: Calculate the Core Metrics
The formulas are straightforward:
lead_to_patient_rate= (patients ÷ leads) × 100patients_per_100_leads= same result, expressed per 100 inquiries
Expressing quality per 100 leads instead of as a decimal (0.03 vs. 3) makes channel comparisons far more intuitive for anyone reviewing the budget.
Step 3: Map Channels to the Bubble Chart
Plot each channel on the CPL vs. patients_per_100_leads grid. Set bubble size to lead volume. Identify which quadrant each channel occupies.
Step 4: Make the Budget Decision
Three decision triggers:
Reallocate budget from bottom-right channels to top-left.
Investigate top-right channels for on-site conversion friction before cutting spend.
Flag bottom-left channels for a 60-day quality audit before scaling further.
Five Actions Your Team Can Take Next Week
Pull 90 days of leads by channel - Match them to consultation bookings in your CRM. If you can't do this, that data gap is problem number one.
Calculate patients_per_100_leads per channel - Use booked consultations as a proxy if patient-start data is incomplete.
Build a three-column table - Channel, CPL, patients_per_100_leads. Share it with whoever approves the marketing budget. The conversation it starts matters more than the table itself.
Compare your top two channels - Check the
lead_to_patient_rateof your largest volume channel against your second-largest. A gap of more than 10 percentage points signals a reallocation opportunity this month.Flag CPL-quality divergence - Find any channel where CPL dropped last quarter but patient volume didn't increase proportionally. That divergence means optimization has been targeting the wrong outcome.
Closing the Loop on Your Best Channels
Once you've identified which channels actually produce patients, the next question is whether your website captures that intent when visitors arrive. Irresist deploys focused patient journeys dynamically based on inferred visitor intent - so the visitor from your highest-quality channel gets the most relevant experience on-site, not a generic homepage. We track forms, calls, and key actions, validate uplift through controlled measurement, and run a weekly optimization loop with a monthly performance review. You've done the channel diagnostic. The on-site layer is what closes the loop. See how it works at irresist.io.
The Bottom Line
CPL tells you what you paid for an inquiry. It says nothing about whether that inquiry becomes a patient. When you pair CPL with lead_to_patient_rate and patients_per_100_leads, you stop optimizing for cheap volume and start optimizing for actual growth. The bubble chart makes that comparison visible in a single view. Run the diagnostic. Share the table. Move budget toward what works.
FAQ
What is a good lead to patient rate for an IVF clinic?
No universal benchmark exists for fertility specifically. The rate depends on your market, service mix, pricing, and how your intake team handles inquiries. What matters more than hitting an industry number is tracking your own baseline and improving directionally quarter over quarter.
How is patients per 100 leads different from a standard conversion rate?
It's the same calculation expressed differently. Instead of saying "our conversion rate is 0.07," you say "we get 7 patients per 100 leads." The per-100 framing helps non-analysts compare channels without squinting at decimal points, which makes budget conversations smoother.
Why does optimizing for low CPL hurt IVF patient volume?
Cheap leads typically come from broader targeting or lower-intent placements. That approach inflates inquiry volume without improving downstream progression - more names in the CRM, but no more consultations booked. You end up paying less per lead and more per patient.
What data do I need to start measuring IVF channel performance properly?
At minimum: channel-level ad spend, leads per channel, and a way to connect those leads to booked consultations or patient starts. CRM tagging by source is usually the missing piece. Without that connection, you're measuring cost without measuring outcome.
How often should a fertility clinic review channel performance using these metrics?
Monthly for active channels with enough volume to draw conclusions. Quarterly for full portfolio reallocation decisions. Use 90-day windows as your default analysis period - shorter timeframes introduce noise from seasonal variation and small sample sizes.