IVF Data Quality Metrics: Why Your Conversion KPIs Need a Confidence Layer
Decision grade IVF analytics require a confidence layer that pairs conversion KPIs with specific data quality metrics to ensure the underlying model is reliable for operational choices. This framework relies on monitoring mapping coverage rates to prevent denominator distortion and tracking status freshness to ensure that pipeline decisions are based on current patient progression rather than stale information.
#4 | Irresist IVF Insights
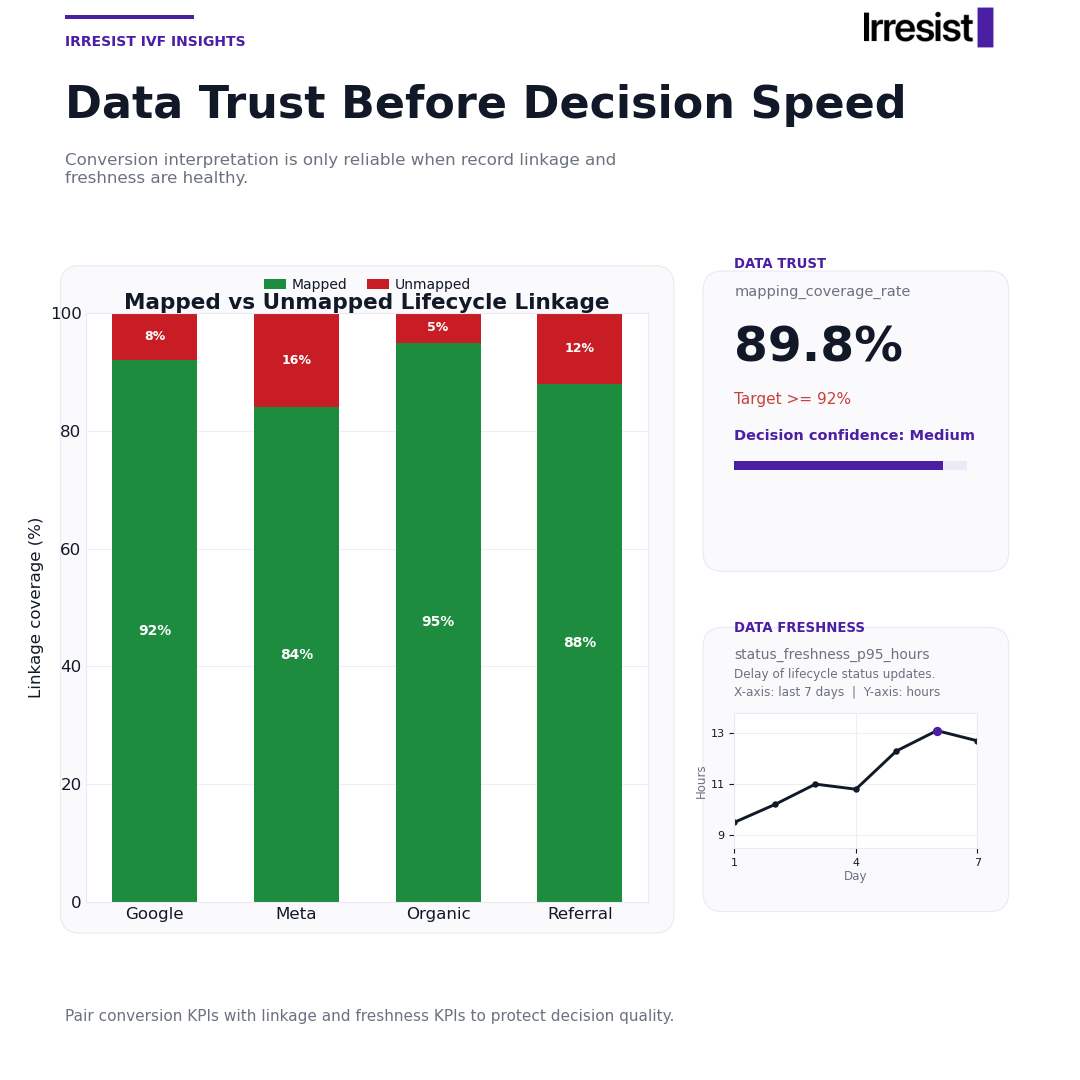
Picture a clinic dashboard where lead-to-patient conversion looks strong across every channel. Budgets get approved, staffing stays flat, and leadership moves on to the next agenda item. Except 16% of Meta leads were never linked to a downstream lifecycle state, so the conversion rate everyone just acted on was calculated against an incomplete denominator. Nobody in the room had a way to know.
This is the core problem with IVF data quality metrics that lack a trust layer. Budget and staffing calls get made on conversion rates that no one can actually verify. The numbers feel precise because they're displayed with decimal points and trend lines, but precision and reliability aren't the same thing.
Conversion KPIs and data-confidence KPIs aren't separate categories. They must be read together, or the conversion number becomes directionally unreliable. This article builds around two confidence metrics: mapping_coverage_rate and status_freshness_p95_hours. Together, they draw the line between presentation-grade analytics and decision-grade analytics. That line has nothing to do with visual design and everything to do with whether the data model can be trusted at operating speed.
Key takeaways
Mapping coverage rate - The share of lead records successfully linked to downstream lifecycle states. When coverage is weak, your conversion denominator is wrong, and performance looks better than reality.
Status freshness matters per-channel - Different sources can have wildly different coverage rates, which means comparing channels without checking linkage quality is structurally invalid.
Stale lifecycle data distorts decisions - If
status_freshness_p95_hoursexceeds 48 hours, you may be making staffing and intake decisions based on pipeline data that no longer reflects reality.Decision-grade analytics require trust controls - A confidence layer pairs every conversion KPI with a threshold, an owner, and a documented breach action.
This is governance, not engineering - Implementing a confidence layer means naming owners and setting thresholds, not rebuilding your data stack.
Why mapping quality changes what conversion numbers mean
Acquisition data (leads, channels, sources) typically lives in one system. Lifecycle progression data (became_patient, service_started) lives in CRM or EMR. The conversion KPI depends on joining these two worlds. When that join fails for a subset of records, those records become invisible to conversion calculations.
A mapped record is one successfully linked to a downstream lifecycle state. An unmapped record couldn't be reliably linked and simply disappears from the model. The metric that captures this is mapping_coverage_rate: mapped records divided by total relevant records.
The distortion is structural. If 16% of Meta leads are unmapped, the lead-to-patient rate for Meta is calculated on 84% of actual leads. The denominator shrinks, and the conversion rate appears healthier than it is. Worse, this problem varies by source, which means CRM/EMR data linkage gaps can make some channel comparisons structurally invalid.
Here's how the same raw conversion numbers tell different stories depending on mapping coverage:
| Source | Apparent lead-to-patient rate | Mapping coverage rate | Adjusted interpretation | Recommended action |
|---|---|---|---|---|
| 14% | 92% | Relatively trustworthy | Monitor coverage, interpret normally | |
| Meta | 15% | 84% | Likely inflated, denominator is missing 16% of leads | Audit linkage before optimizing spend |
| Organic | 18% | 95% | High confidence | Use as benchmark source |
| Referral | 12% | 88% | Moderate confidence, check for intake handoff gaps | Reconcile unmapped records before comparing to other channels |
Without checking healthcare analytics data trust at the source level, you're comparing numbers that aren't built on the same foundation.
What stale lifecycle data does to dashboard decisions
The second confidence metric is status_freshness_p95_hours: the 95th percentile of delay between a lifecycle status update in the source system and the moment the reporting layer evaluates it. The p95 matters more than the average because it shows the worst-common-case lag. 95% of records are at or below that delay, while 5% are slower.
The lifecycle states feeding conversion KPIs include lead_created, became_patient, and service_started. These are the commercial progression markers that make dashboards useful.
When status_freshness_p95_hours reaches 52 hours, a clinic reviewing Friday's dashboard may be looking at Wednesday's patient progression data while making Thursday intake staffing decisions. In IVF, where intake follow-up and consultation scheduling depend on knowing the current pipeline state, stale data produces decisions calibrated to a pipeline that no longer exists.
A practical threshold for dashboard confidence metrics is 48 hours. Above that line, lifecycle-dependent KPIs should be flagged as low-confidence until freshness is restored.
Building a confidence layer: KPI, threshold, owner, action
Every conversion KPI on a leadership dashboard should be accompanied by the data-quality control that qualifies whether interpreting that KPI is currently safe. The confidence layer follows a four-part structure: what's measured, the threshold where confidence changes, who owns monitoring, and what happens when the threshold is breached.
| KPI | Threshold | Confidence signal | Owner | Breach action |
|---|---|---|---|---|
| mapping_coverage_rate | Below 92% | Medium | Data/ops lead | Audit source linkage by channel |
| status_freshness_p95_hours | Above 48h | Low | CRM/EMR administrator | Check source sync, pause lifecycle-dependent decisions |
| Parity mismatch control | Any material discrepancy between CRM count and reporting layer count | Low | Analytics lead | Reconciliation before next reporting cycle |
Decision confidence is a synthetic signal, not a single metric. It's a composite read of whether mapping coverage and status freshness together make the conversion KPIs safe to act on. Data-confidence KPIs need named owners and documented response procedures. Without ownership, they exist on a chart but trigger no action.
The distinction is straightforward: presentation-grade analytics show what the numbers say. Decision-grade analytics also show whether those numbers can be trusted right now.
Confidence governance checklist
Use this as a readiness check for your IVF analytics layer. This isn't a technical audit. Any operations or analytics lead can complete it without engineering support.
Does your dashboard display
mapping_coverage_ratealongside conversion KPIs?Is there a defined threshold for mapping coverage below which the conversion view is flagged as unreliable?
Does your dashboard display
status_freshness_p95_hoursas a visible metric, not a background log?Is there a defined freshness threshold (such as 48 hours) above which lifecycle-dependent KPIs are treated as low-confidence?
Is there a named owner for each data-confidence metric who is responsible for breach response?
Is there a documented action protocol for when a threshold is breached, not just an alert, but a defined response step?
Are channel-level mapping coverage rates tracked separately, so source comparisons are only made between comparably linked datasets?
Do your leadership reviews include a data-confidence status summary before conversion KPIs are discussed?
If you checked fewer than five, your dashboard may be presentation-grade. It looks clean, but it can't tell you whether its own numbers are reliable enough to act on.
The bottom line
IVF data quality metrics aren't a secondary concern layered on top of conversion reporting. They're the structural foundation that determines whether conversion reporting means anything at all. A dashboard without mapping_coverage_rate and status_freshness_p95_hours can still produce charts and trend lines. It just can't tell you whether those charts reflect reality closely enough to make a staffing call or shift a channel budget.
The fix isn't a data warehouse rebuild. It's a governance decision: add two metrics, set thresholds, name owners, and document what happens when confidence drops. That's the difference between analytics you present and analytics you operate on.
If your leadership dashboards don't show data-quality KPIs next to conversion KPIs, that's the gap to close first. Irresist builds confidence layers into IVF analytics from day one because strategy only works when the underlying data can be trusted at operating speed.
FAQ
What is mapping_coverage_rate, and why does it matter for IVF dashboards?
mapping_coverage_rate is the share of lead records successfully linked to a downstream lifecycle state, such as became_patient or service_started. It's calculated as mapped records divided by total relevant records. When coverage is low, the denominator used for conversion calculations shrinks, which inflates the apparent conversion rate and distorts the performance view your team relies on.
What does status_freshness_p95_hours measure, and what is a safe threshold?
status_freshness_p95_hours measures the 95th percentile of delay between a lifecycle status update in the source system and the moment your reporting layer evaluates it. It affects states like lead_created, became_patient, and service_started. A practical threshold is 48 hours: above that, lifecycle-dependent KPIs should be flagged as low-confidence because your dashboard may be showing pipeline data that's two or more days old.
How does poor CRM/EMR data linkage affect IVF conversion reporting?
Acquisition data and lifecycle progression data live in separate systems. When the join between them fails, affected records drop out of conversion calculations entirely. For example, if a channel has 84% mapping coverage, the lead-to-patient rate is calculated on only 84% of actual leads, making that channel appear to convert better than it does. This makes cross-channel comparisons unreliable without checking coverage by source.
What is the difference between presentation-grade and decision-grade analytics?
Both can look identical on screen. Same charts, same numbers, same formatting. The difference is that decision-grade analytics include trust controls, such as mapping coverage and status freshness, that tell you whether the numbers are currently reliable enough to act on. Presentation-grade analytics show what the data says. Decision-grade analytics also show whether you should believe it right now.
Can a small IVF clinic team implement a confidence layer without a dedicated data engineering team?
Yes. The confidence layer is an operational governance framework, not a technical build. The practical entry point is naming an owner for each data-confidence metric, setting thresholds for when confidence drops, and adding mapping_coverage_rate and status_freshness_p95_hours to your existing dashboard. Most clinic teams can start with these steps using their current tools and workflows.