In IVF, conversion often drops in the minutes nobody reports on
IVF lead conversion is primarily driven by the speed of initial contact because potential patients often choose the first clinic that responds to their inquiry. Maintaining a high rate of contact within five minutes is the most effective way to prevent revenue loss and outperform competitors who allow leads to sit unaddressed for longer periods.
#2 | Irresist IVF Insights
IVF clinics pour budget into paid media, SEO, and website redesigns. All smart investments. But a lead that sits uncontacted for 30 minutes is statistically unlikely to convert - regardless of how compelling the ad was. Response time feels like an operational detail, something the front desk owns. In practice, it behaves like a commercial variable with a measurable decay curve that compounds across every lead, every month.
The data consistently suggests that contacted_within_5m_rate is one of the strongest predictors of IVF lead to patient rate. Clinics that track it tend to outperform those that don't. What follows is a breakdown of how to read the response time decay curve, which metrics to track, how to separate a traffic-quality problem from a workflow-latency problem, and what a practical lead response SLA for IVF looks like.
Key Takeaways
Response time is a revenue input - Each response-time bucket (under 5 min through over 60 min) maps to a meaningfully different conversion rate, and the drop is steep, not gradual.
The 5-minute window matters disproportionately - Leads contacted within 5 minutes convert at rates that dwarf later buckets, making
contacted_within_5m_ratethe single metric most worth protecting.Low conversion in late buckets has two possible causes - Poor traffic quality and slow workflow both produce the same symptom; separating them requires source-level and time-of-day segmentation.
An SLA without a named owner is a suggestion - Assign the response metric to a specific role, define escalation triggers by bucket, and review weekly.
Fertility clinic intake speed is uniquely high-stakes - IVF patients comparison-shop multiple clinics in narrow windows; the first clinic to respond often wins the consult.
Why Response Time Is a Commercial Variable
Response time is not a courtesy metric. It's a conversion input with a calculable impact on revenue per lead. Each response-time bucket - under 5 minutes, 5-15 minutes, 15-30 minutes, 30-60 minutes, over 60 minutes - corresponds to a different lead_to_patient_rate. The curve drops steeply in the first few buckets, then flattens. That steep early drop is where the money lives.
IVF is particularly sensitive to this dynamic. Patients are emotionally primed, often comparison-shopping two or three clinics during a lunch break or after hours. 78% of customers buy from the first company that responds to their inquiry. In fertility, where the decision carries real emotional weight, that first-responder advantage is even more pronounced. A slow response doesn't just delay a conversation - it hands it to a competitor.
Make the math concrete: a clinic generating 200 leads per month that moves its contacted_within_5m_rate from 20% to 50% shifts 60 additional leads into the highest-converting bucket. Even a modest conversion uplift of a few percentage points across those leads compounds quickly when you factor in the lifetime value of an IVF cycle.
Reading the Chart: Buckets, Bars, and the Conversion Line
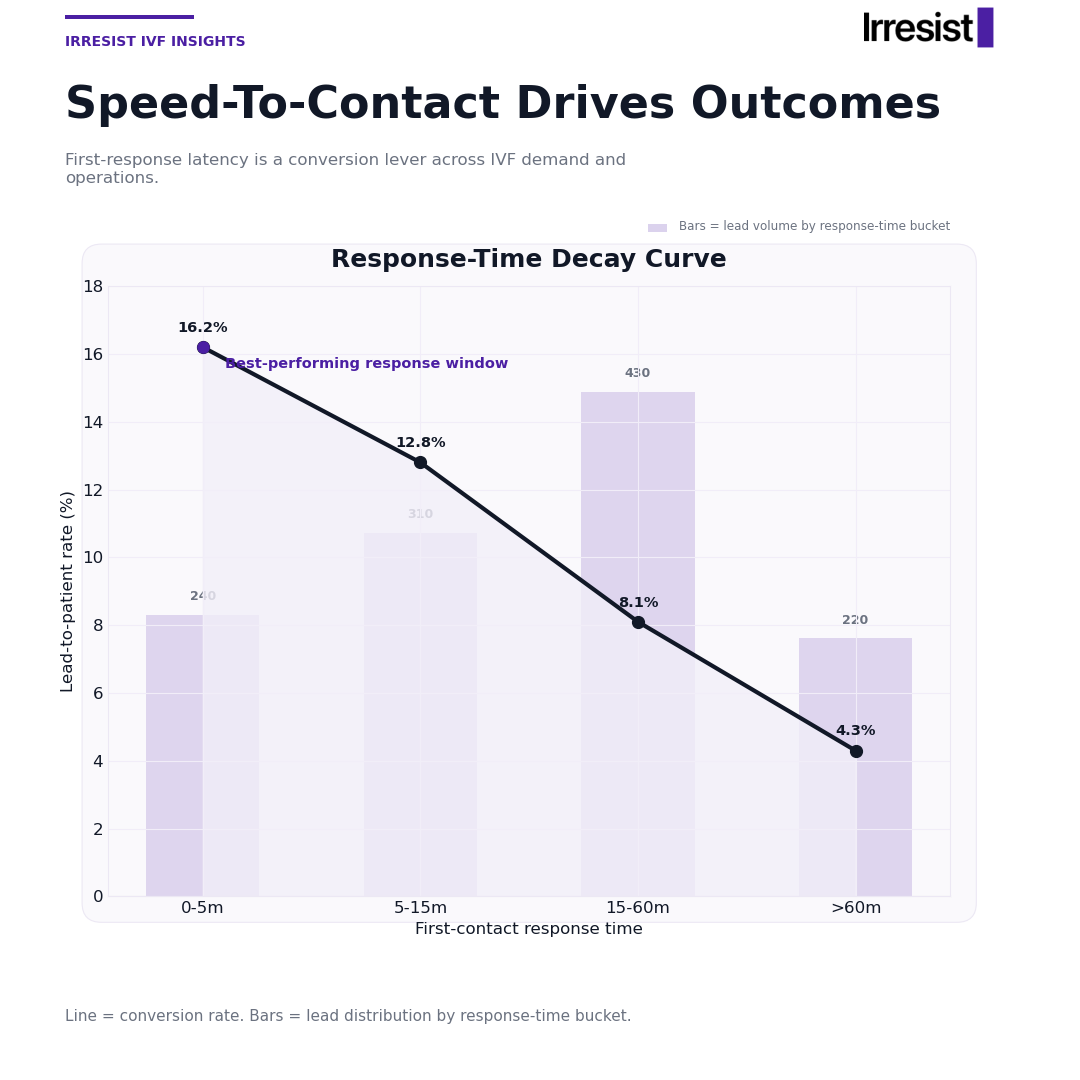
The Irresist IVF Insights chart for this article uses a dual-axis structure. The bars show lead volume distribution across response-time buckets. The line shows lead_to_patient_rate for each bucket. These tell two different stories, and you need to read them together.
Start with the bars. Most clinics will find the bulk of their leads sitting in the 30-60 minute or over-60-minute buckets. That's the volume reality check - it shows where your leads actually land, not where you assume they do.
Now follow the line. Conversion peaks sharply in the under-5-minute bucket and decays across subsequent buckets. The steepness of that decay is your opportunity cost made visible. The gap between the under-5-minute conversion rate and the 30-60-minute rate is not a rounding error - it's the revenue difference between a staffed intake desk and an unmonitored form.
One important caveat: the chart doesn't tell you why late-bucket conversion is low. It could be slow response. It could be lower-quality leads submitting at off-hours. That diagnostic requires a second layer of analysis.
Separating Traffic Quality From Workflow Latency
This distinction matters more than most clinic operators realize. Attribute poor late-bucket conversion to lead quality alone, and you'll under-invest in fixing your intake workflow. Blame workflow without checking lead quality, and you'll invest in speed without improving outcomes.
Traffic-Quality Diagnostic
Segment late-responding leads by source - paid search, organic, referral, social. If conversion is uniformly low across sources in late buckets, latency is likely the driver. If it's source-specific, look at the traffic mix first.
Workflow-Latency Diagnostic
Map where time is lost. CRM notification delay? Team handoff gaps? Off-hours coverage holes? Manual triage slowing first contact? Each failure point has a different fix.
Traffic Quality vs. Workflow Latency - How to Tell the Difference
| Diagnostic Signal | Points to Traffic Quality | Points to Workflow Latency |
|---|---|---|
| Conversion rate by lead source | Low in specific sources only | Low uniformly across sources |
| Lead volume in late buckets by time of day | Concentrated in off-hours | Spread across business hours |
| Response time variance across team members | Consistent across reps | High variance between reps |
| contacted_within_5m_rate by channel | Similar rates across channels | Significantly different by channel |
Most clinics will find a mix of both. The goal is to isolate the larger driver and sequence fixes accordingly.
The SLA Playbook: Ownership, Monitoring, and Escalation
A response SLA that lives in a slide deck is decoration. One that's tied to a named owner, a monitoring rhythm, and an escalation path is infrastructure. Here's how to build one for fertility clinic intake speed.
Response-Time Buckets as SLA Tiers
Set a starting benchmark: contacted_within_5m_rate of 50% or above for clinics with standard business-hours inquiry volumes. This is a directional target, not a universal standard.
Assign explicit ownership to a named role - the intake coordinator or patient success lead who holds the metric, not a department.
| Time Bucket | SLA Status | Action Required | Owner |
|---|---|---|---|
| Under 5 min | On target | Log and continue | Intake coordinator |
| 5-15 min | Acceptable | No action unless trending | Intake coordinator |
| 15-30 min | Needs review | Flag in the weekly report | Operations lead |
| 30-60 min | At risk | Immediate review | Operations lead |
| Over 60 min | Breach | Escalate + root cause | Clinic director |
Monitoring Cadence
Weekly - Pull
contacted_within_5m_rate, average response time by bucket, andlead_to_patient_rateby bucket. Review as a standing item in ops meetings.Monthly - Review trend lines across four weeks. Compare against prior month's lead volume to control for demand shifts.
Real-time - CRM alerts when a lead has not been contacted within 10 minutes during business hours. Route to the escalation path immediately.
Escalation Logic
Two tiers keep this manageable. Tier 1: same-day notification to the intake team lead when any lead crosses 30 minutes uncontacted. Tier 2: director-level review when contacted_within_5m_rate drops below 30% in any rolling seven-day window.
Distinguish systemic failures (coverage gaps, CRM misconfiguration) from isolated incidents (staff absence). Root cause logging prevents the same failure from repeating.
What to Measure Weekly
This is the minimum viable measurement set for any clinic serious about improving IVF lead to patient rate.
contacted_within_5m_rate- Percentage of leads contacted within 5 minutes of inquiry submission.lead_to_patient_rateby response-time bucket - Conversion rate segmented across the five standard buckets.Lead volume by bucket - How many leads landed in each response window this week vs. last week.
Average response time by channel - Are paid leads being responded to faster than organic, or vice versa?
Off-hours lead volume - What percentage of leads arrived outside staffed hours, and what was the next-business-day response rate?
SLA breach count - Number of leads that crossed the 30-minute threshold uncontacted, with a root cause note.
Week-over-week trend - Is
contacted_within_5m_ratemoving up, flat, or down compared to the prior three weeks?
See Where You Stand
If you're running an IVF clinic and wondering how your contacted_within_5m_rate stacks up, we can help you pressure-test the numbers. Irresist works with fertility clinics to turn existing website traffic into more booked consults - and response time decay is one of the first levers we look at. Reach out to compare your intake metrics against similar clinics in the Irresist cohort, and follow along with the Irresist IVF Insights series for the next installment.
The Bottom Line
IVF response time is not a support metric - it's a conversion variable with a steep, measurable decay curve. The difference between contacting a lead in under five minutes and contacting them in 30 minutes is not an incremental change; it's often a multiple. Clinics that treat contacted_within_5m_rate as a standing KPI - owned by a named role, monitored weekly, and escalated when it slips - consistently convert more leads into patients from the same traffic. Fix the intake clock before you redesign the landing page.
FAQ
What is a good IVF response time for incoming leads?
The under-5-minute benchmark is the target most supported by conversion data. The odds of contacting a lead in 5 minutes versus 30 minutes drop 100 times, and the odds of qualifying that lead drop 21 times. The exact target varies by clinic size and staffing hours, but pushing contacted_within_5m_rate above 50% during business hours is a strong starting point for most fertility clinics.
How is contacted_within_5m_rate calculated?
Divide the number of leads contacted within 5 minutes by the total number of leads in the measurement period. "Contacted" means a first meaningful outreach attempt - a phone call, a personalized text, or a live chat reply. A CRM task being auto-created does not count. The metric only captures whether a human reached out within the window.
What is lead_to_patient_rate, and how does response time affect it?
lead_to_patient_rate is the percentage of leads who progress to a booked or completed consultation. Response time affects it through a decay relationship: leads in the under-5-minute bucket convert at significantly higher rates than those in later buckets, and the drop is steepest between the first and second buckets. Tracking this metric by bucket shows you where your conversion opportunity is leaking.
How do I know if my conversion problem is a traffic-quality issue or a response-speed issue?
Segment late-bucket leads by source (paid, organic, referral, social). If conversion is uniformly low across all sources in the slower buckets, latency is likely the primary driver. If low conversion is concentrated in one or two sources, the traffic mix deserves attention first. Also, check whether late-bucket leads cluster in off-hours, and compare response time variance across team members.
What should a fertility clinic's response SLA include?
Four elements: a named owner (a specific role, not a department), response-time tier definitions mapped to the standard buckets, a monitoring cadence (weekly metric pulls, monthly trend reviews, real-time CRM alerts), and escalation logic (tier 1 for individual breaches, tier 2 for sustained rate drops). See the SLA Playbook section above for the full framework.