How p50 and p90 Reveal the IVF Conversion Problems Averages Hide
Analyzing IVF conversion through p50 and p90 percentiles allows operations teams to identify hidden funnel bottlenecks that standard averages often conceal. While the p50 metric represents the typical conversion path for most patients, the p90 metric reveals the tail risk where operational failures like qualification delays or inconsistent follow up cause specific cases to stall.
#3 | Irresist IVF Insights
Every IVF operations team has lived this moment: the quarterly report shows an average lead-to-patient conversion time of 13 days, leadership nods, and then the quarter closes short. No one can explain where the patients went.
The average wasn't wrong. It just collapsed the full distribution of cases into a single number that hid what was happening at the edges. Fast conversions and slow conversions blended into a moderate-looking figure that triggered no alarms and prompted no investigation.
IVF funnel percentiles tell a different story. When you read lead_to_patient_days_p50 and lead_to_patient_days_p90 together, you see the typical path and the tail risk side by side. This article explains what these metrics mean, how to interpret the gap between them, what a widening gap signals operationally, a root-cause framework for diagnosing problems, and a weekly review template that your team can run in under 30 minutes.
Key Takeaways
Averages flatten your funnel - Fast and slow cases blend into a moderate number that hides the fact that 10% of leads may be taking more than twice as long as the median to convert.
p50 shows the typical path, p90 shows the drag - Reading them together reveals whether your process delivers consistent timing or breaks down for a subset of cases.
A widening instability gap is a diagnostic signal - It points to specific operational failures: qualification delay, follow-up inconsistency, handoff friction, or triage variation.
Weekly percentile review catches problems monthly reporting misses - A five-step review using only p50, p90, and the gap gives operations teams an early-warning system before slow periods compound into lost quarters.
You don't need a data team to start - You need two metrics, a consistent schedule, and a willingness to investigate rather than just report.
Why Averages Hide Funnel Problems
When fast cases and slow cases get averaged together, the result looks moderate even when the slow cases represent a systemic failure. Consider this: if your p50 is 10 days and your p90 is 22 days, the average might report 13 days. That number triggers no alarm, but it conceals the fact that 10% of your leads are taking more than twice as long as the median to convert.
In IVF, those slower-converting cases are often the patients who needed the most support at the most sensitive decision point and received the least consistent follow-up. Teams optimizing for average conversion time end up investing effort in the wrong places - speeding up already-fast cases rather than fixing the structural delays affecting the slowest ones. The p50 vs p90 conversion time comparison catches what averages smooth over.
Reading p50 and p90 Together
lead_to_patient_days_p50 is the 50th percentile of lead-to-patient duration. Half of all cases convert faster than this number; half take longer. This is the typical path.
lead_to_patient_days_p90 is the 90th percentile. Ninety percent of cases convert within this duration; the slowest 10% take longer. This is where funnel tail risk lives.
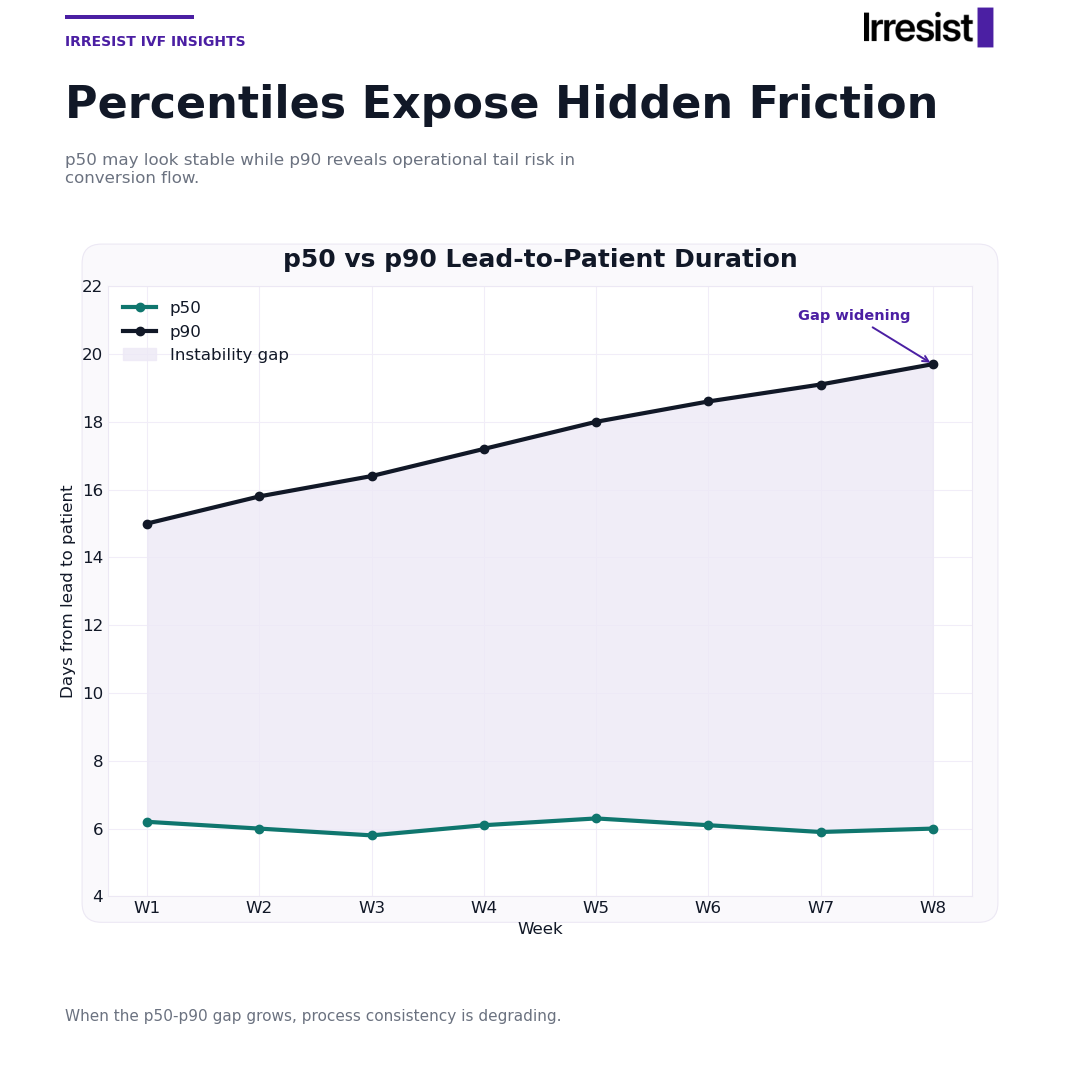
The instability gap is the difference between p90 and p50 in days. A small gap means consistent timing regardless of which staff member handles the case or which channel the lead came from. A large gap means something is breaking down for a subset of cases.
In the graphic, the filled area between the two trend lines represents this instability gap week over week. When that area widens, IVF operations consistency is degrading - even if the p50 line looks flat. A "healthy" pattern is both lines tracking close together with a stable or narrowing gap. Both lines can be elevated and still represent a more consistent process than a low p50 paired with a high p90.
What a Widening Gap Is Telling You
A widening instability gap is a diagnostic signal, not just a reporting artifact. Most gaps trace to one or two of these root causes at the same time.
Qualification Delay
Leads enter the funnel but don't receive a qualification decision quickly or consistently. Fast-converting cases get early qualification while slow cases drift without a clear next step. Signal: lead to patient days p90 rises over several weeks while p50 holds steady.
Follow-Up Inconsistency
Some leads receive prompt, structured follow-up. Others fall into a lower-priority queue with no enforced cadence. This produces a bimodal distribution - some cases convert in seven days, others in 25, and the averages report something around 14 that represents almost no one's actual experience. Signal: high week-to-week variance in p90 even when p50 is stable.
Handoff Friction
Transitions between stages (inquiry to consult scheduling, consult to patient) introduce delays when ownership is unclear. Cases requiring a handoff outside the standard workflow disproportionately accumulate in the tail. Signal: the gap widens in weeks following changes to staffing, scheduling systems, or team structure.
Triage Variation
Different team members apply different urgency thresholds to similar cases, producing different timelines for leads that should be handled identically. This is often invisible in average reporting but shows up clearly in p90 drift. Signal: case-level review of flagged high-p90 weeks reveals specific staff members or intake channels overrepresented in slow cases.
Diagnosing the Gap: A Symptom-to-Cause Table
Use this table during weekly reviews to match what you observe in the data to the most likely cause and the confirming metric to pull.
| Symptom | Likely Cause | Metric to Confirm |
|---|---|---|
| p90 rising while p50 is stable | Tail cases falling through follow-up or qualification | lead_to_patient_days_p90 week-over-week trend vs p50 trend |
| Both p50 and p90 rising together | Systemic slowdown affecting all cases | Compare both metrics to prior 4-week rolling average |
| Gap widens after a staffing or workflow change | Handoff friction introduced by the change | Stage-level conversion time before and after the change date |
| Gap widens inconsistently with no clear trigger | Triage variation by staff or channel | Case-level review for p90 spike weeks; check intake source and assigned team member |
| Gap is consistently large but stable | Structural process issue baked into funnel design | Qualification rate, speed-to-contact, and consult-to-patient stage durations |
This table is a starting point, not a verdict; confirming the cause requires pulling the supporting metric and reviewing a sample of cases from the flagged period.
Weekly Review Template for Operations Teams
This is a repeatable five-step process any operations team can run in under 30 minutes per week using only p50, p90, and the instability gap.
Pull this week's values - Record lead_to_patient_days_p50, lead_to_patient_days_p90, and calculate the instability gap (p90 minus p50) for the current week.
Compare to the prior 4-week average - Note whether p50, p90, and the gap are trending up, down, or stable. Flag any week where the gap widened by more than three days versus the prior week.
Run the symptom check - Use the diagnostic table above to match the observed pattern to the most likely root cause.
Pull the confirming metric - Don't assign a cause based on the symptom alone. Pull the metric listed in the table and verify before acting.
Log and act - Document the week's values, suspected cause, confirming metric result, and the action taken or deferred. This log becomes the audit trail for whether interventions are working over time.
This review doesn't require a data team. It requires two metrics, a consistent schedule, and a willingness to investigate rather than report.
The Bottom Line
IVF funnel percentiles replace the single-number comfort of averages with a diagnostic view that shows where your process is consistent and where it's quietly failing. Reading p50 and p90 together gives operations teams an early-warning system - one that catches qualification delays, follow-up gaps, handoff friction, and triage variation before they compound into a lost quarter.
Start with the weekly review template. Pull two numbers, calculate the gap, and ask what the pattern is telling you. If your reporting layer only surfaces averages, Irresist provides percentile-level visibility across the full lead-to-patient funnel so you can see where consistency breaks down and act before it costs you patients.
FAQ
What is lead_to_patient_days_p50, and how is it different from average conversion time?
lead_to_patient_days_p50 is the median - the middle value in the distribution of lead-to-patient durations. Half of the cases are faster, half are slower. Unlike the average, p50 isn't skewed by outliers. It shows the experience of the typical case rather than a blended number pulled upward by a small number of very slow conversions.
Why does p90 matter more than p50 for diagnosing funnel problems?
p90 captures the tail where process failures concentrate. p50 can look perfectly healthy while p90 is deteriorating week over week, which is exactly the scenario where averages mislead teams into thinking everything is fine. If you're only watching one metric for early diagnosis, p90 is the more revealing number.
What is a healthy instability gap for an IVF funnel?
There's no universal benchmark. A 5-day gap might be fine for one clinic and a problem for another, depending on their funnel length and patient mix. The goal is a gap that's narrowing or stable over time. Context is the trend, not the absolute value - focus on direction rather than hitting a specific number.
How often should an IVF operations team review p50 and p90?
Weekly review is the minimum useful cadence. Monthly review misses the window to intervene before a slow period compounds into a lost quarter. Weekly review using the five-step template gives you enough signal to catch problems early while they're still correctable with targeted action.
What tools or data setup does a clinic need to start tracking these percentile metrics?
The underlying data is typically already in your CRM or lead management system - you have timestamps for lead creation and patient conversion. The missing piece is usually a reporting layer that surfaces percentile breakdowns rather than only averages. This is what Irresist provides: percentile analytics for healthcare funnels so operations teams can see p50, p90, and the instability gap without building custom reports.